LAB 9 - Mapping
PID Control
In order to realize the control of the rotation angle via PID control, I first get the angle of rotation of the car (yaw) by integrating gyroscope's angular velocity along the Z axis. Then used yaw to calculate the error in PID control.
//integration of angular velocity of the Z axis
        now = millis();
        d_t = now - pre;
        pre = now;
        get_IMU();
        yaw_g += myICM.gyrZ() * d_t / 1000;

//calculate error using yaw_g
        err = yaw_g - intercept;

//get new gyroscope data
        void get_IMU(){
            while(!myICM.dataReady()){
              delay(1);
            }
            myICM.getAGMT();
          }
In the settings of the PID control, I set the intercept in the loop to be 10 degrees, which means
each independent PID control will make the car rotate 10 degrees counterclockwise from its original orientation.
(The starting direction is always towards the positive direction of the X axis)
Outside of a single PID loop I recorded the total rotation angle at the same time,
and let the car continue to perform single independent PID control until the total rotation angle reached 360 degrees.
So I can get about 36 data at each sampling point.
Read Out Distances
Through the PID control of angle mentioned above, I obtained raw polar coordinate data at 5 standard points: (0,0), (0,3), (5,3), (5,-3), (-3,-2). Then I convert the polar data to Cartesian data and draw the graphs using the following formula:
x = r·cos(θ)
y = r·sin(θ)


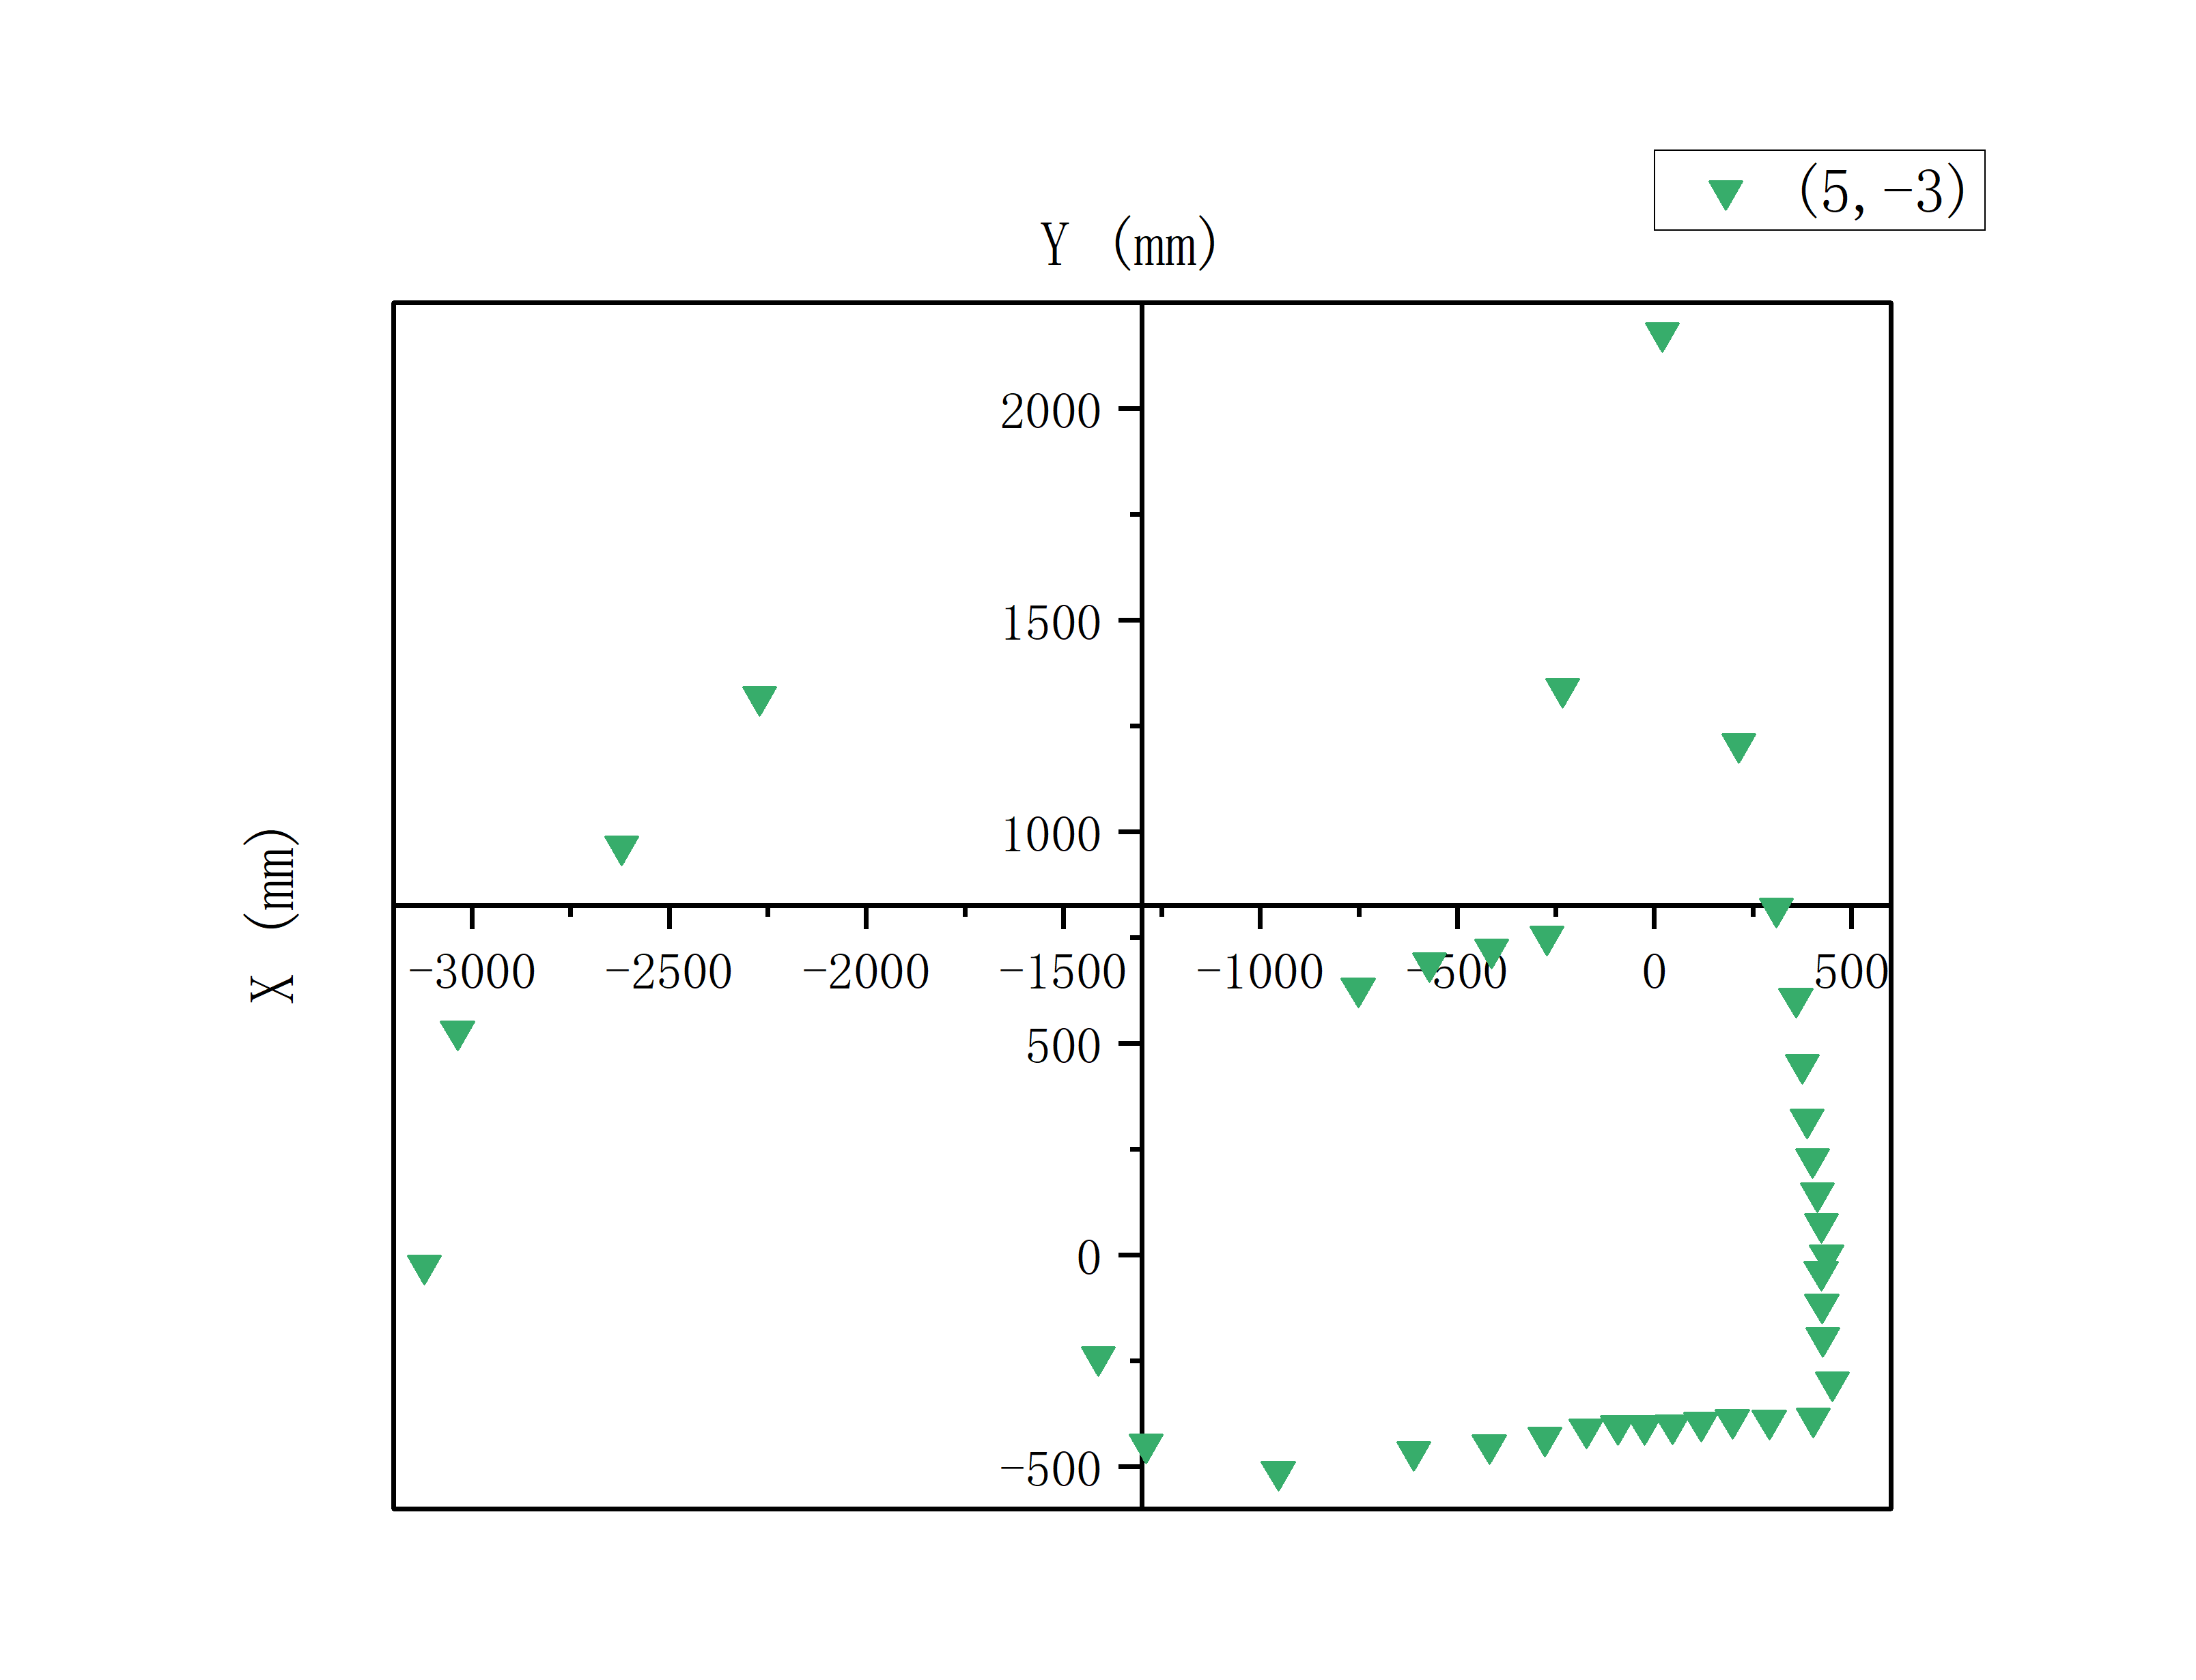
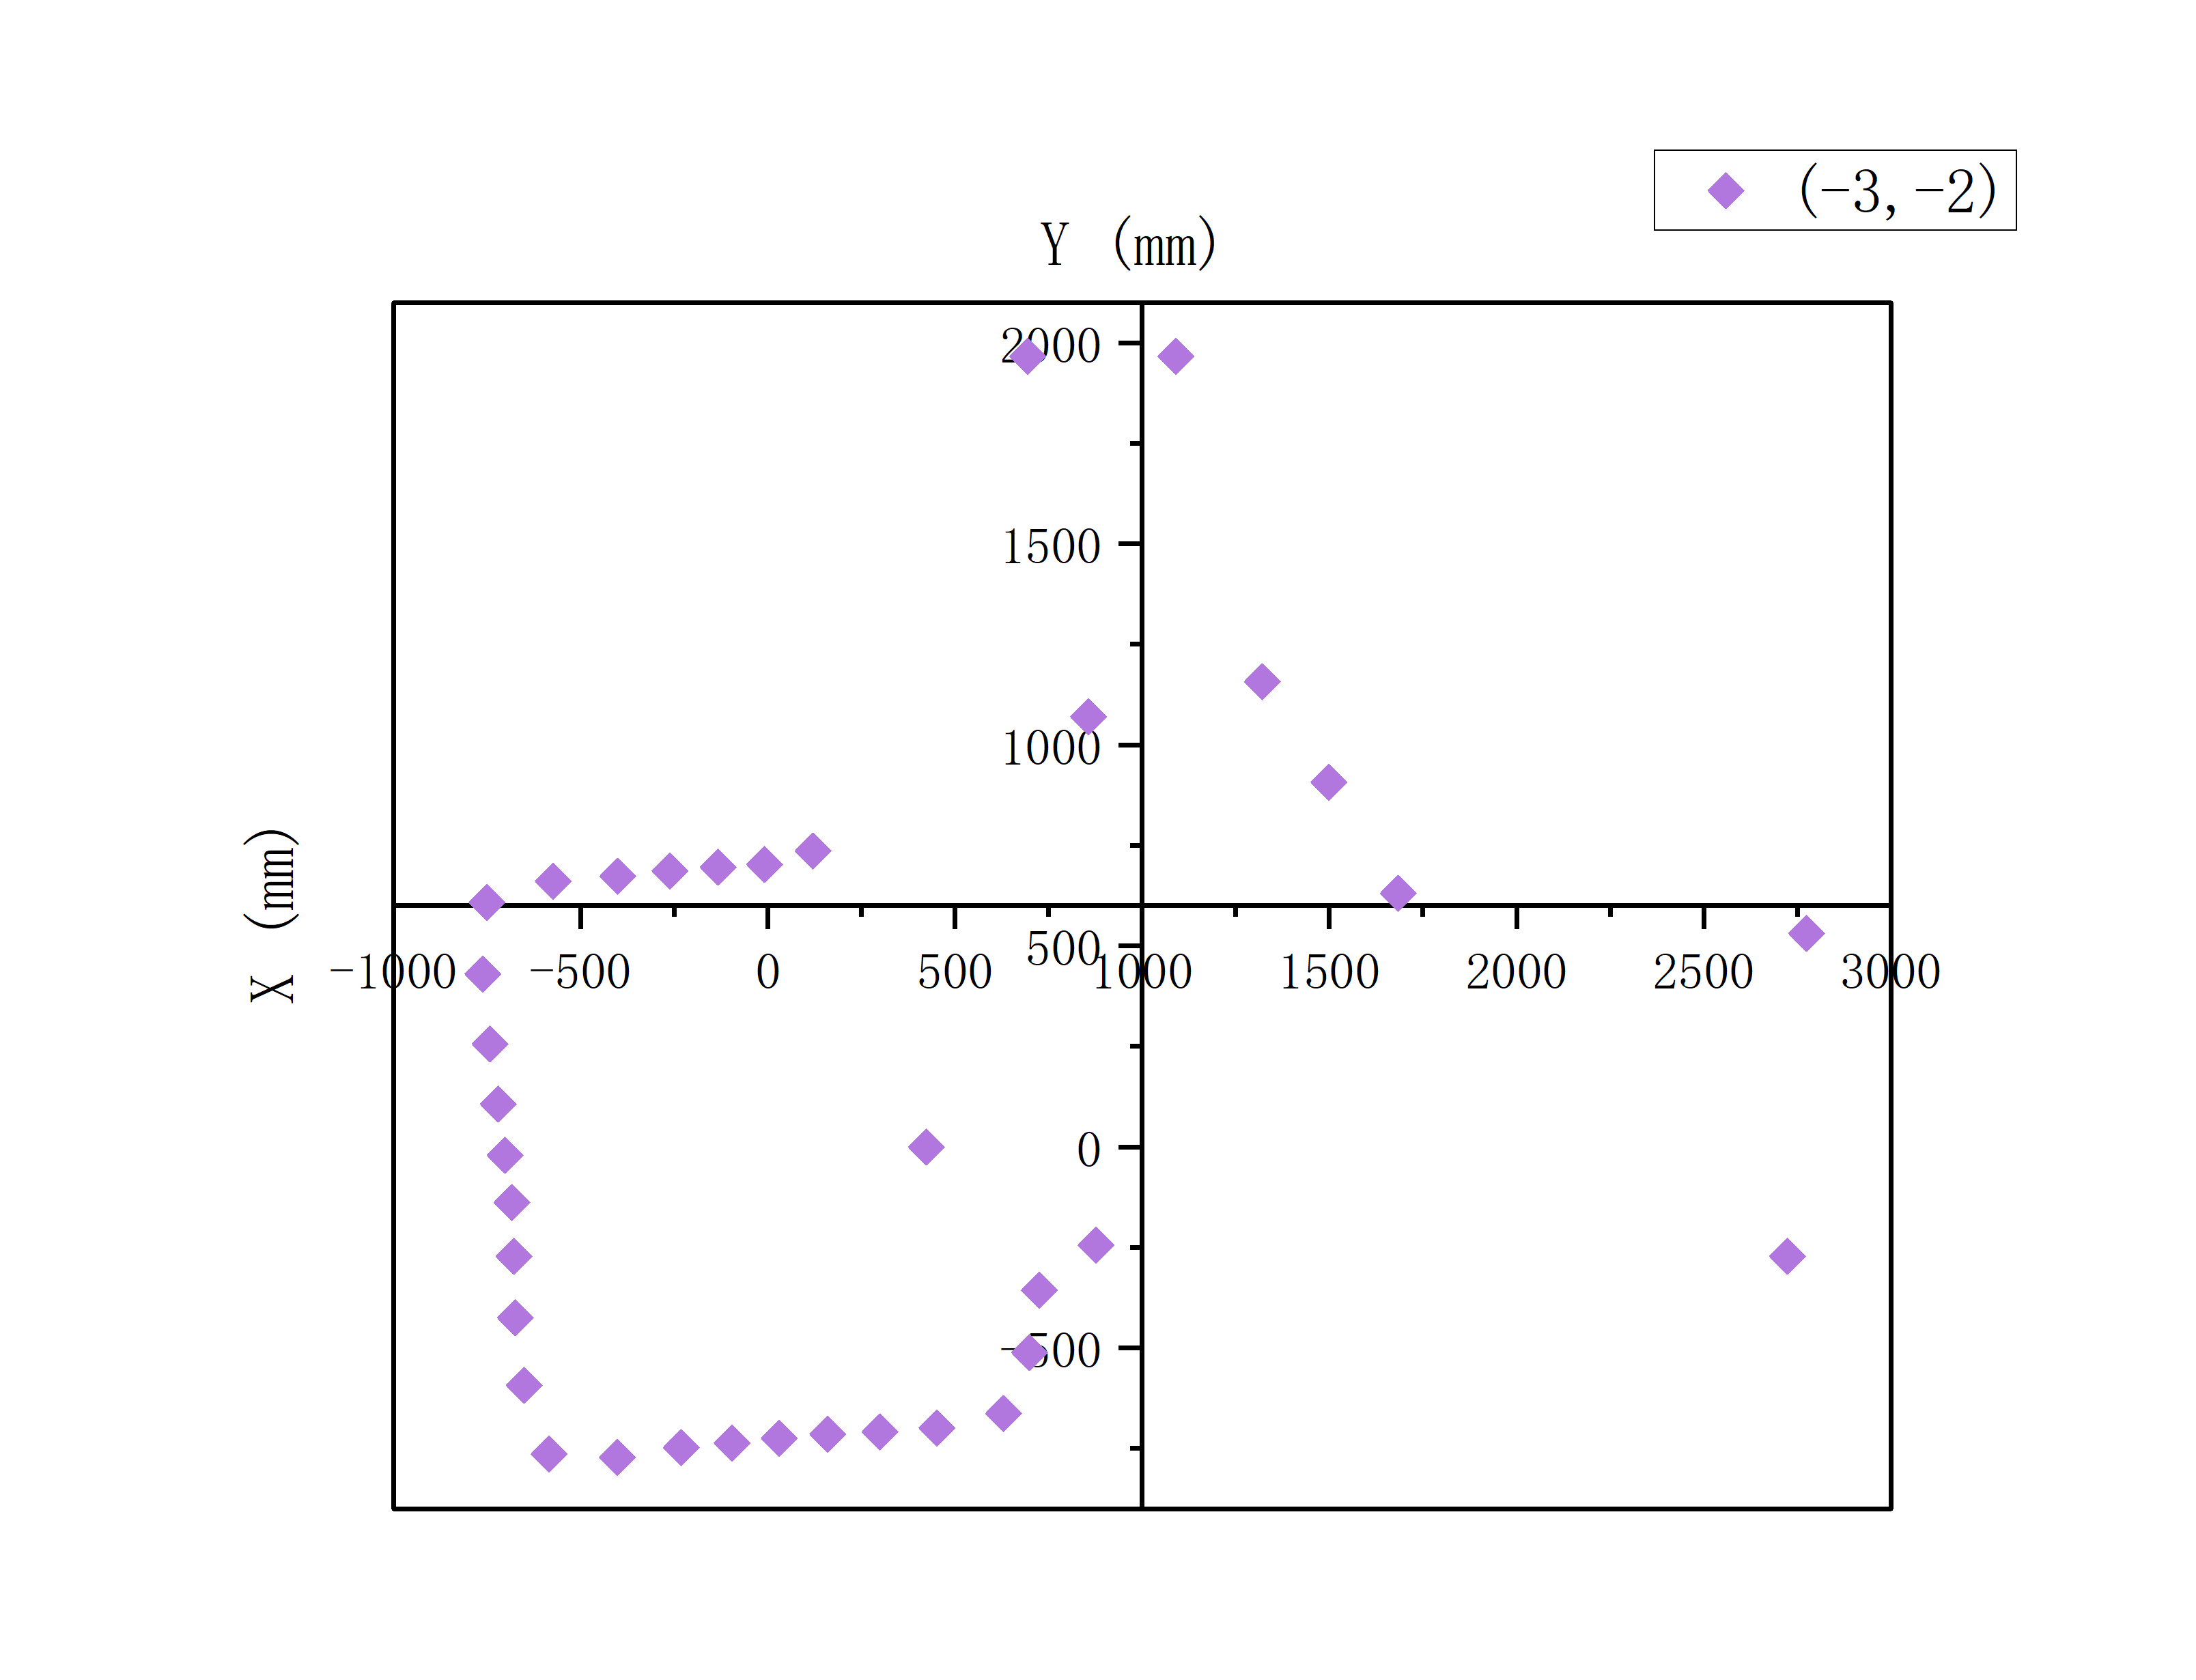
For the above data, I first rotated the data at each point by 0-10 degrees to make it relatively aligned with the XY coordinate axis,
and then translated the data correspondingly according to the coordinates of the sampling point.
For example, I did the following with the data taken at point (5,3) (The length represented by each unit coordinate is 300mm)
The X-axis coordinate value of each data point +1500,
the Y-axis coordinate value of each data point +900
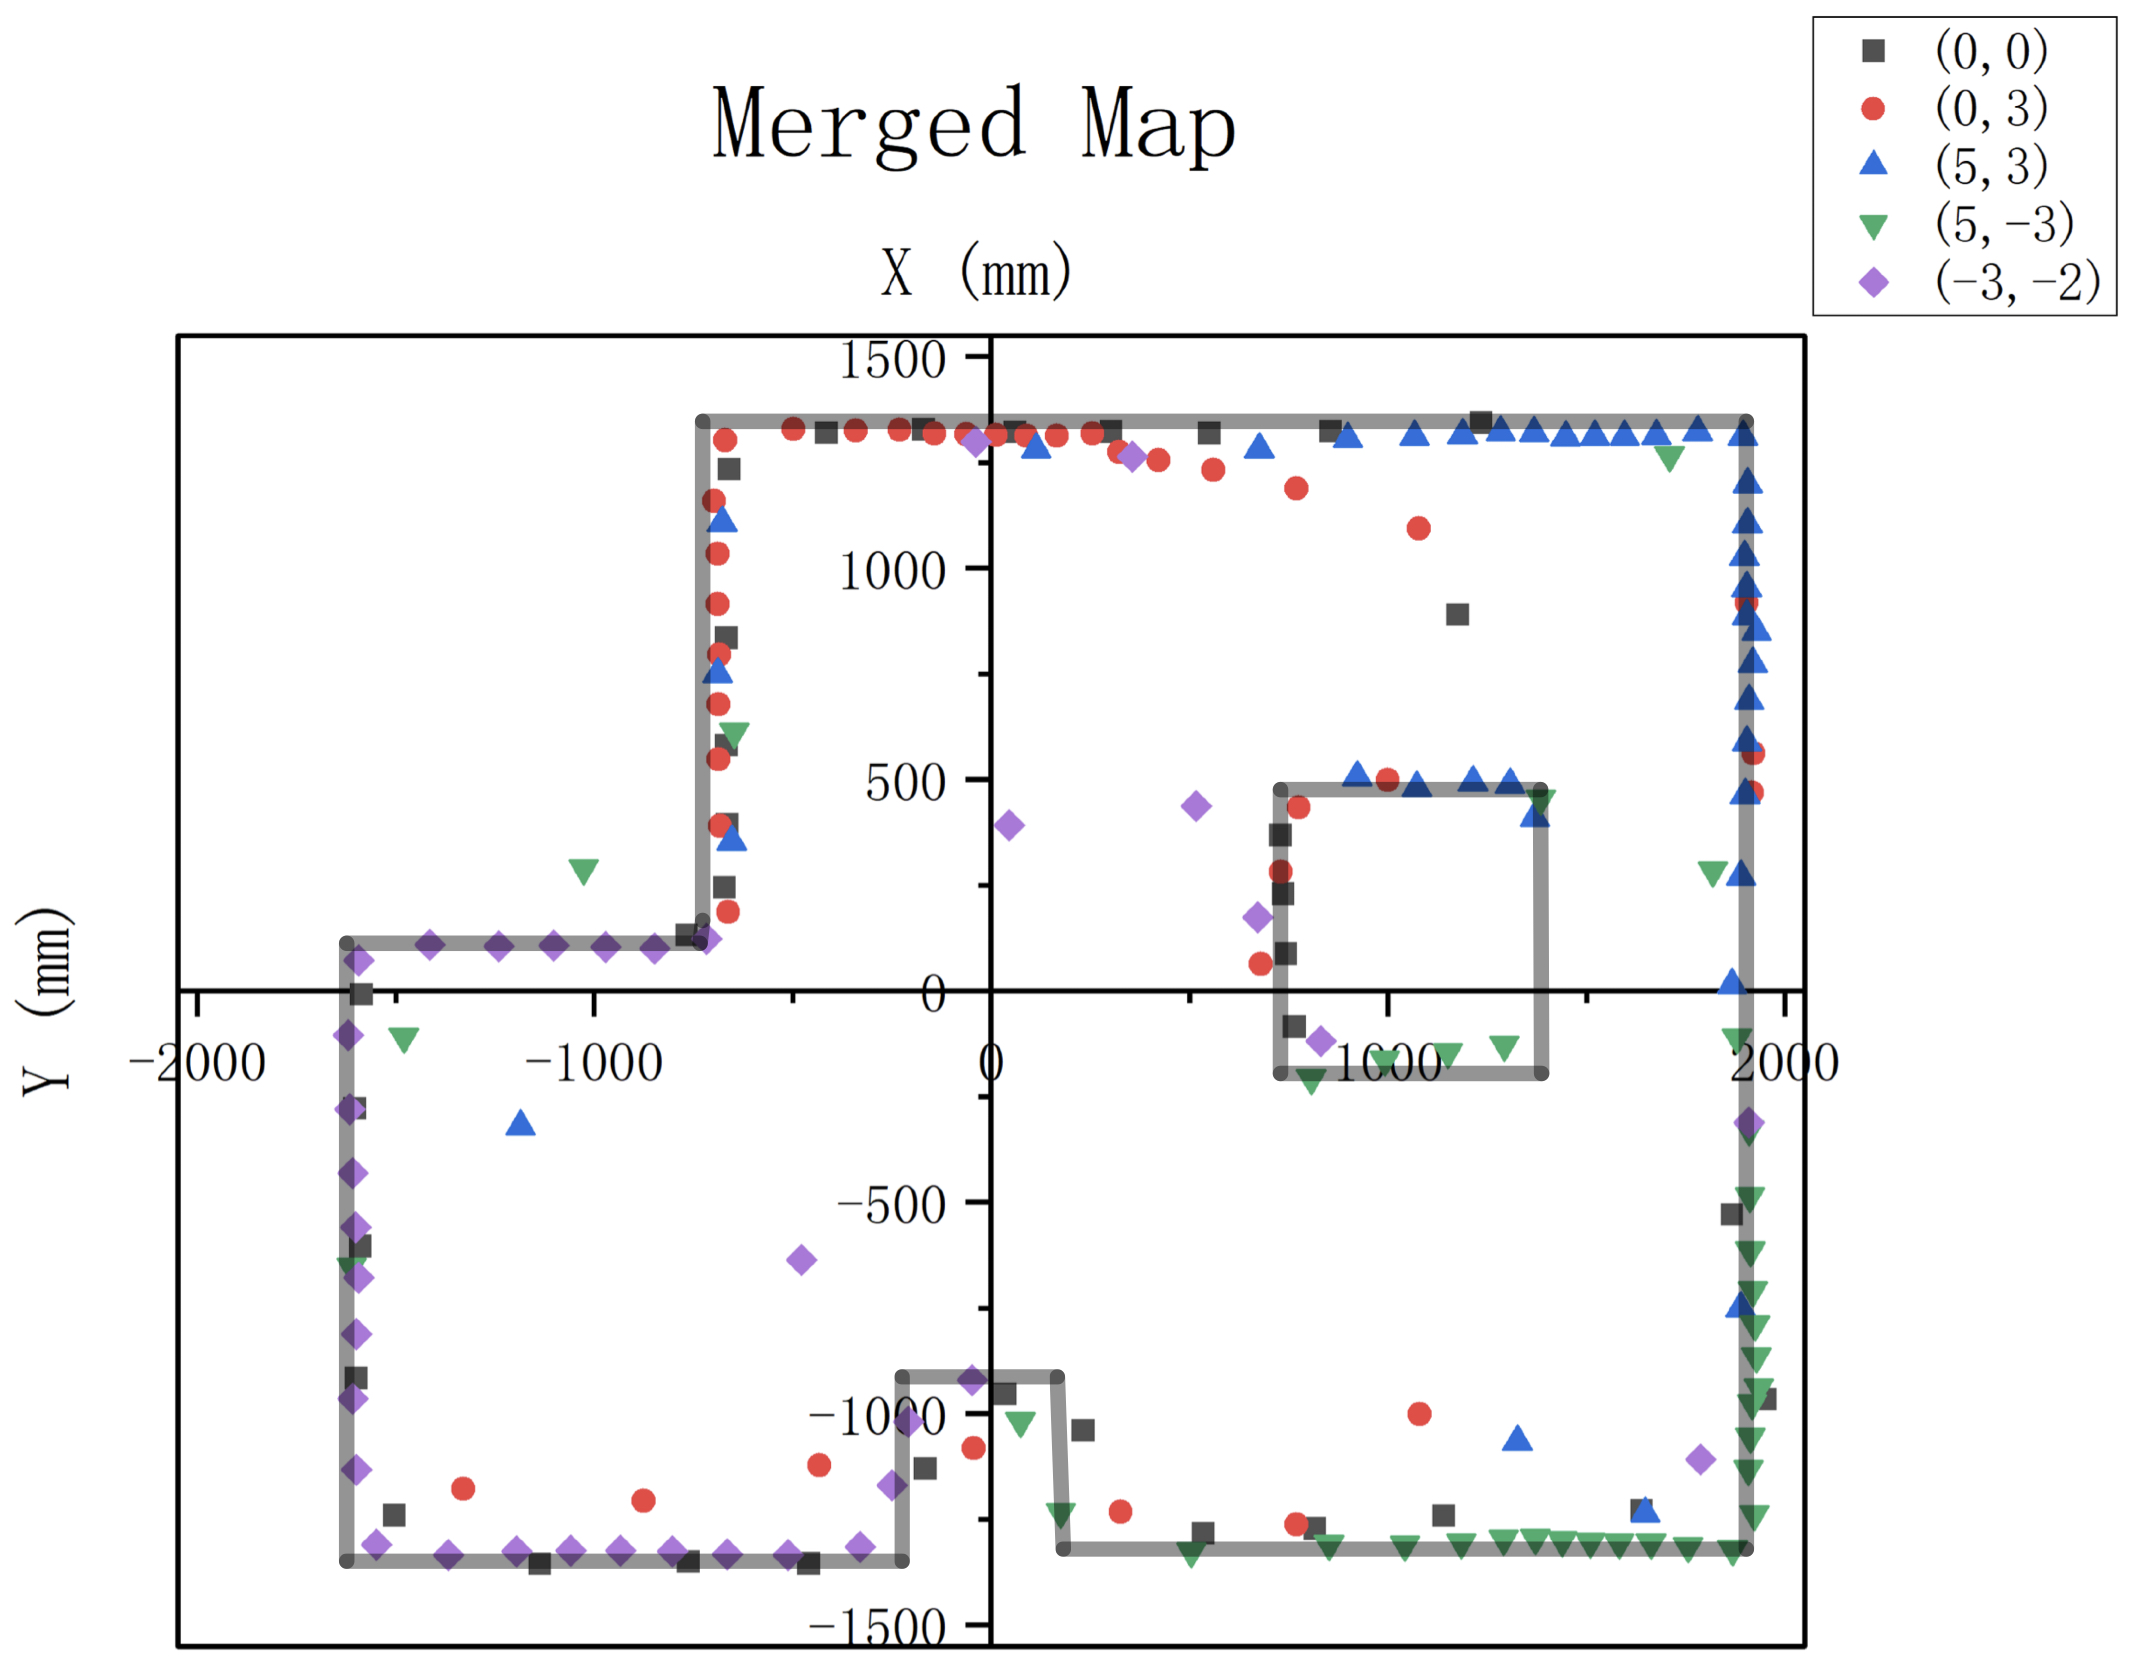
Then I merged all the data into one graph below and used different colors and markers to distinguish their sampling points:
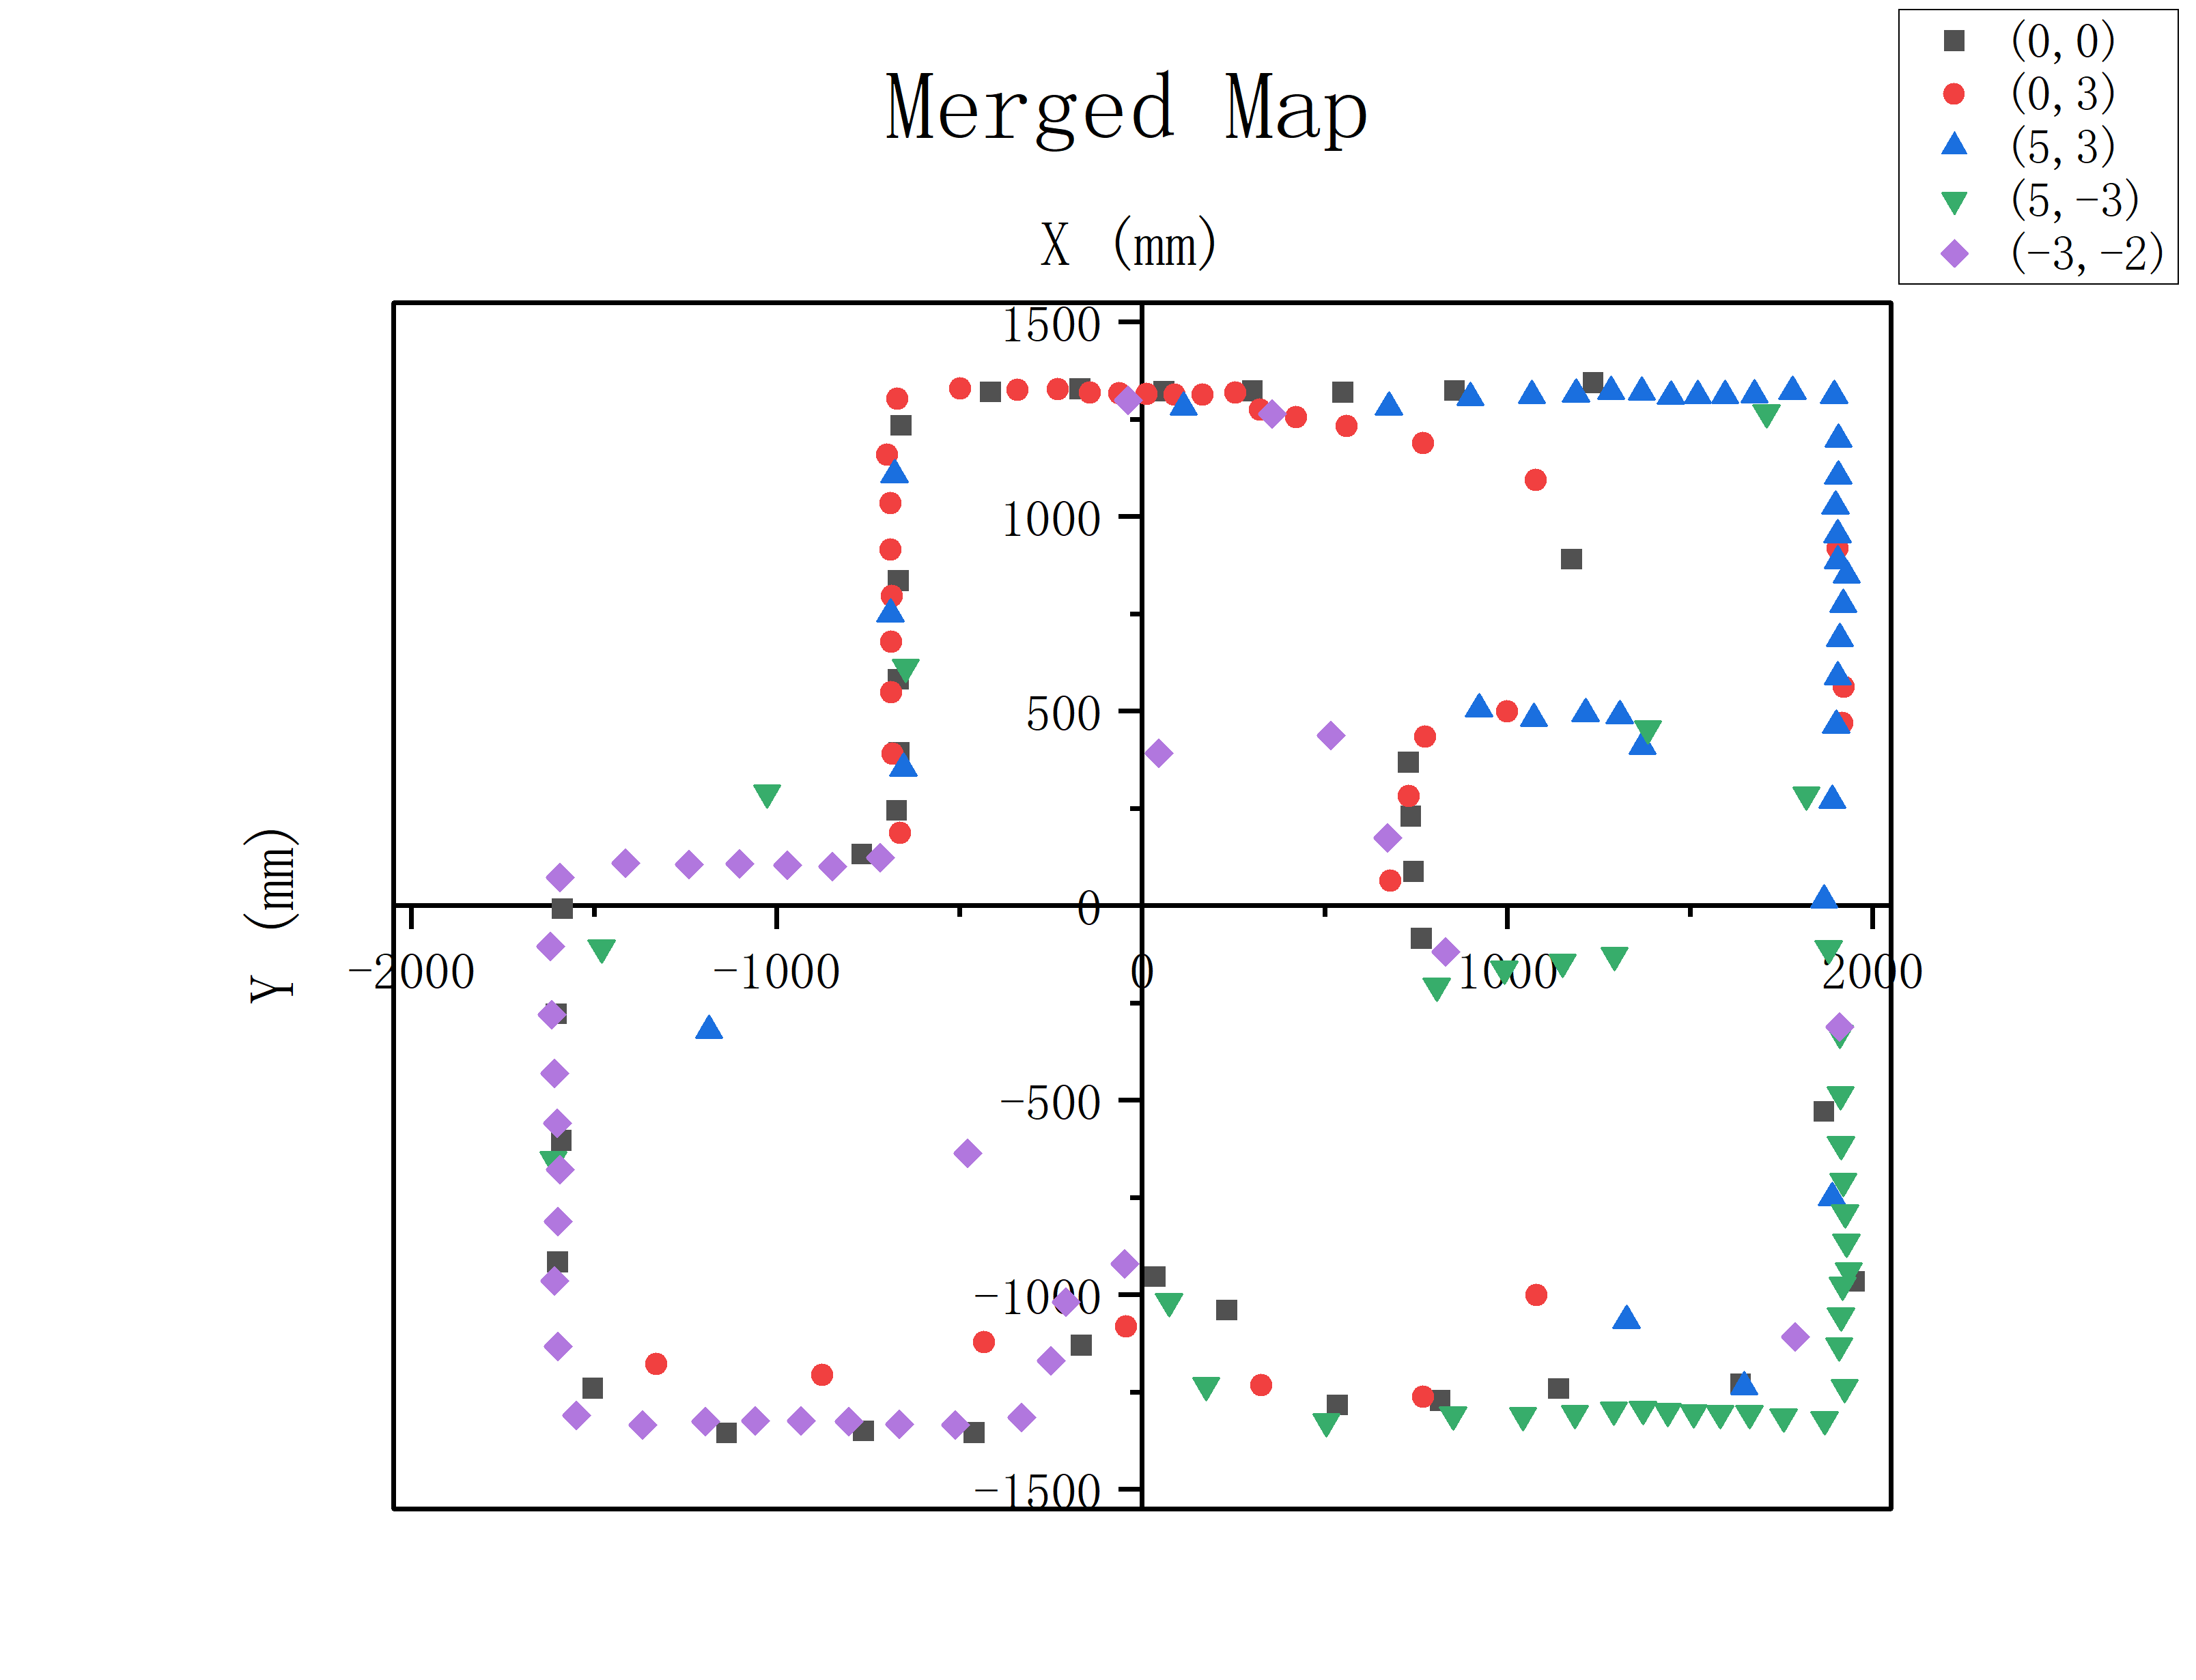
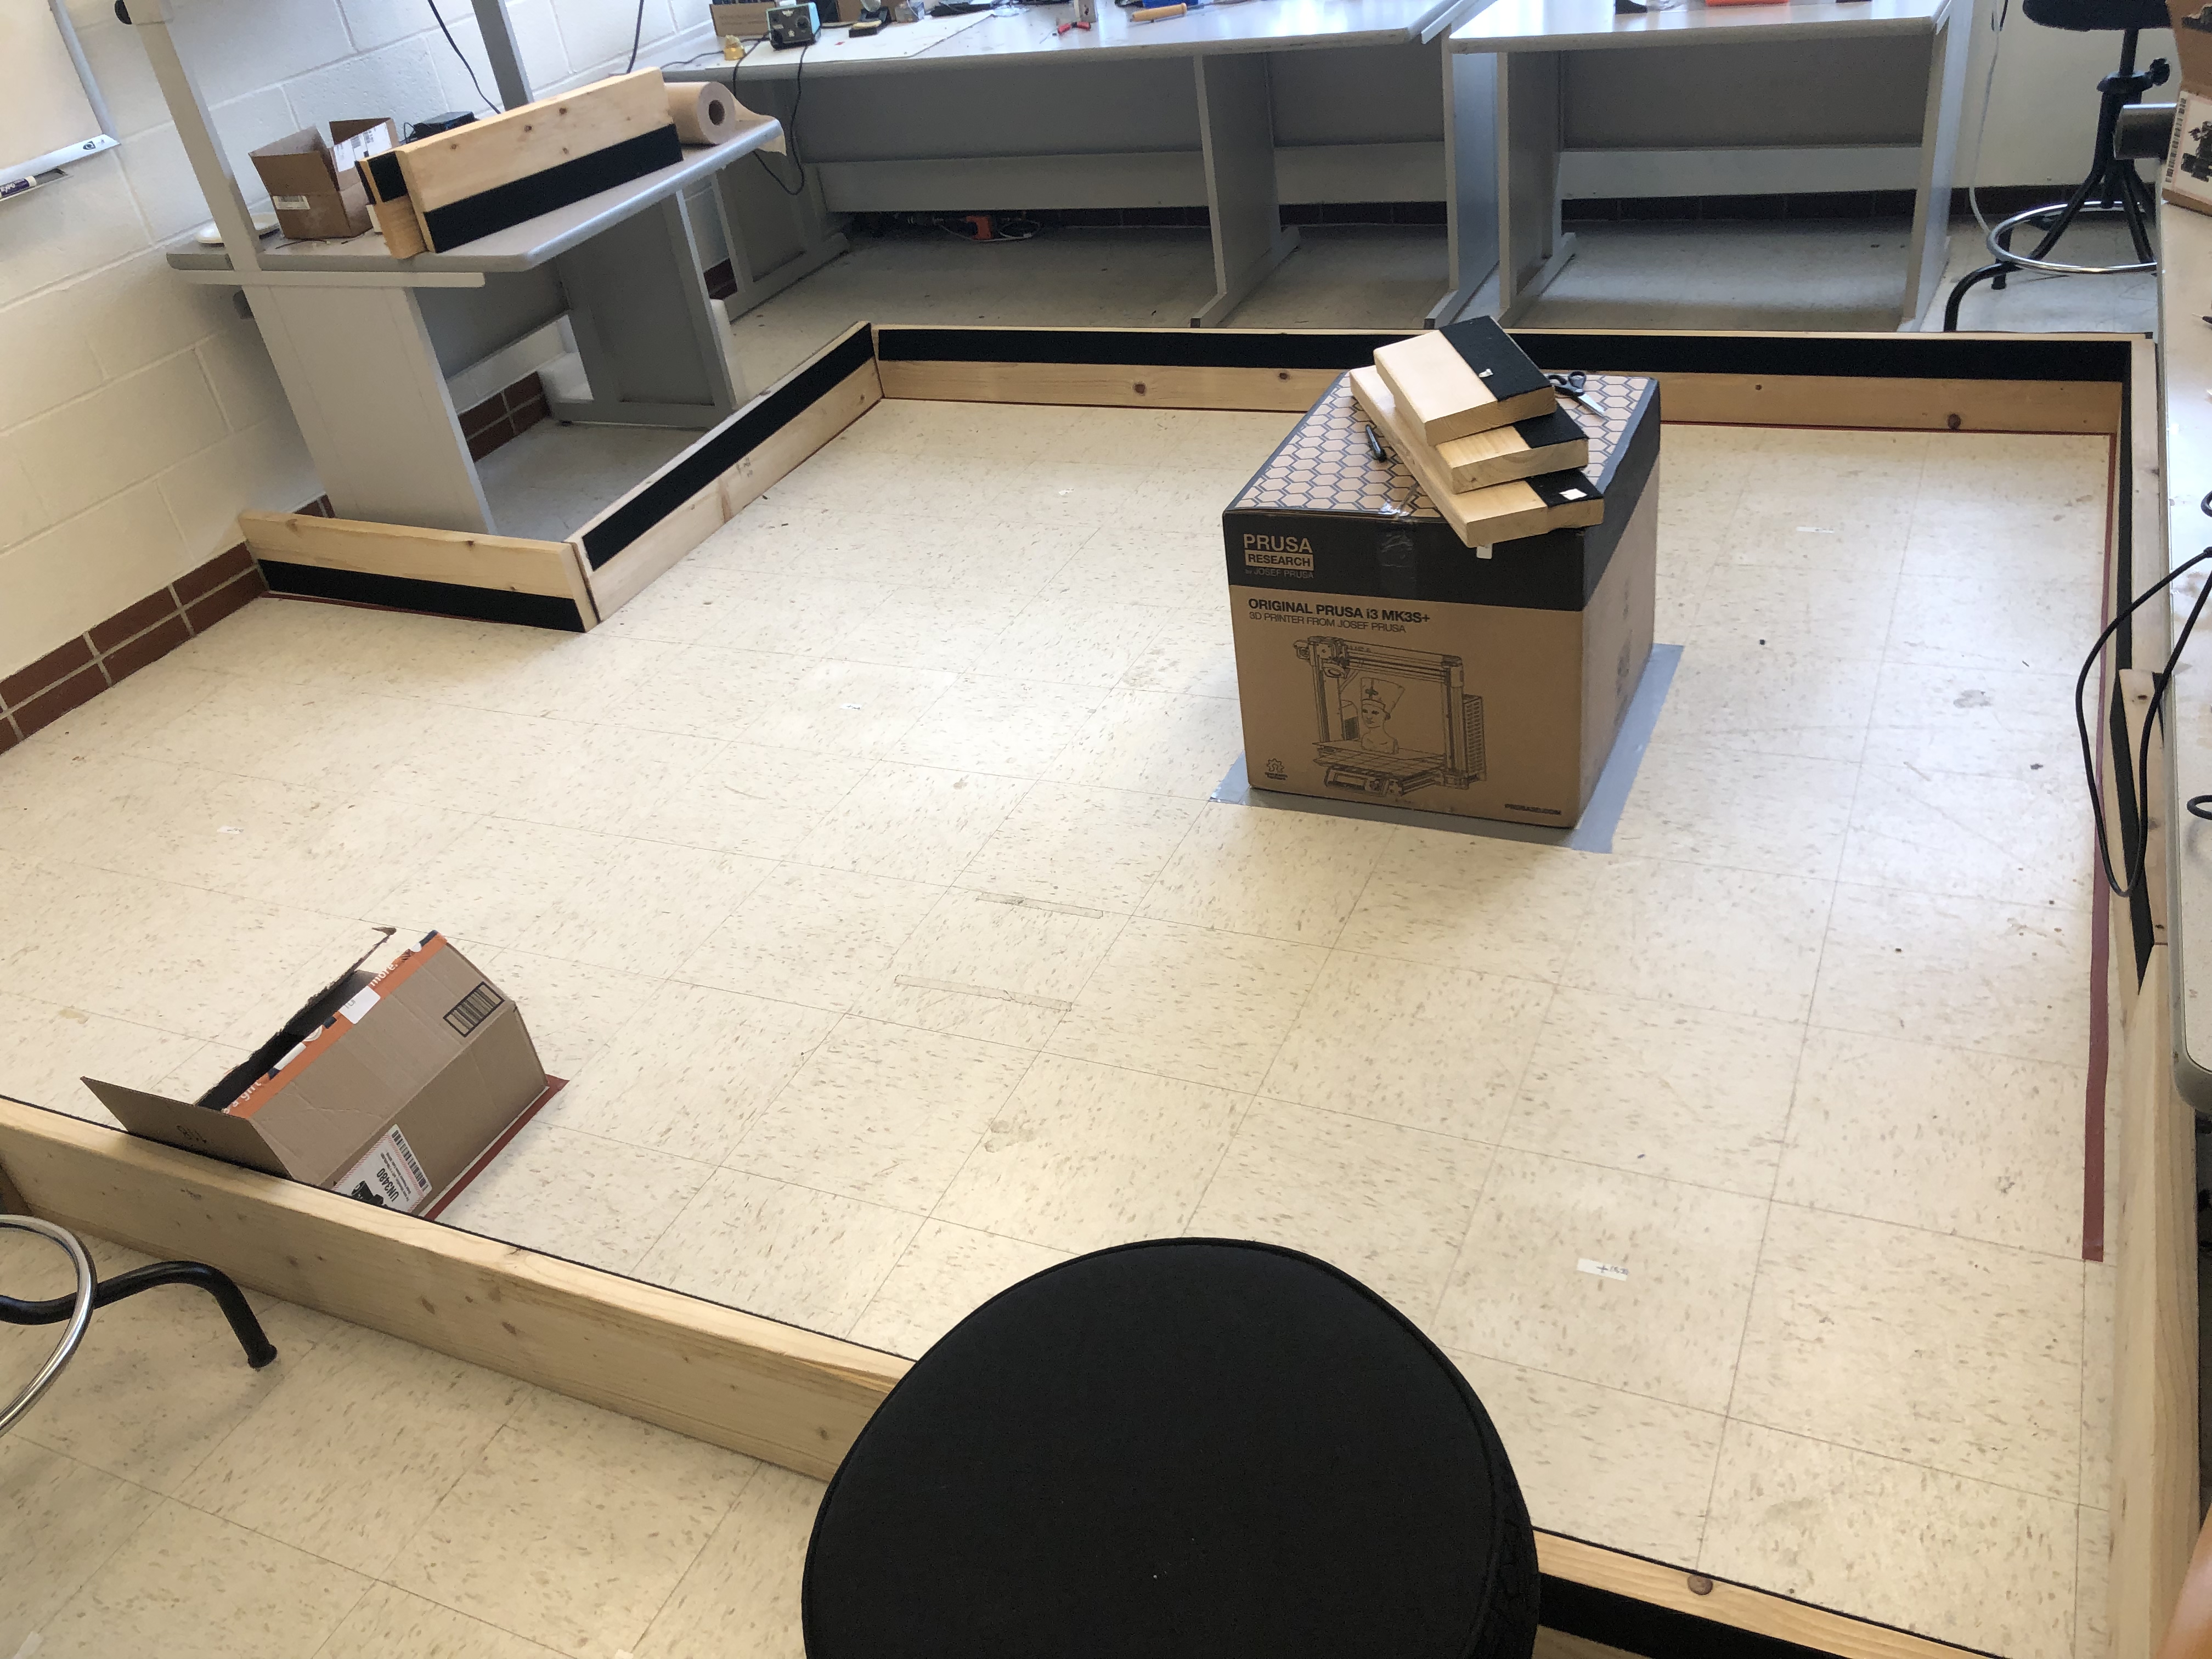
It can be seen from the outline of the graph that it perfectly matches the photo of real map:
Discussions
Let the maximum error of the actual rotation center deviating from the theoretical center be σ1
Let the distance from the ToF to the actual center of rotation be σ2
Let the measurement accuracy of ToF be σ3
As shown in the figure below, the actual measurement point may be located at any point within the entire circle:
(The radius of the circle is (σ1 + σ2))

Assuming the same probability of the measurement point at all locations, the average error is obtained by the following calculation:
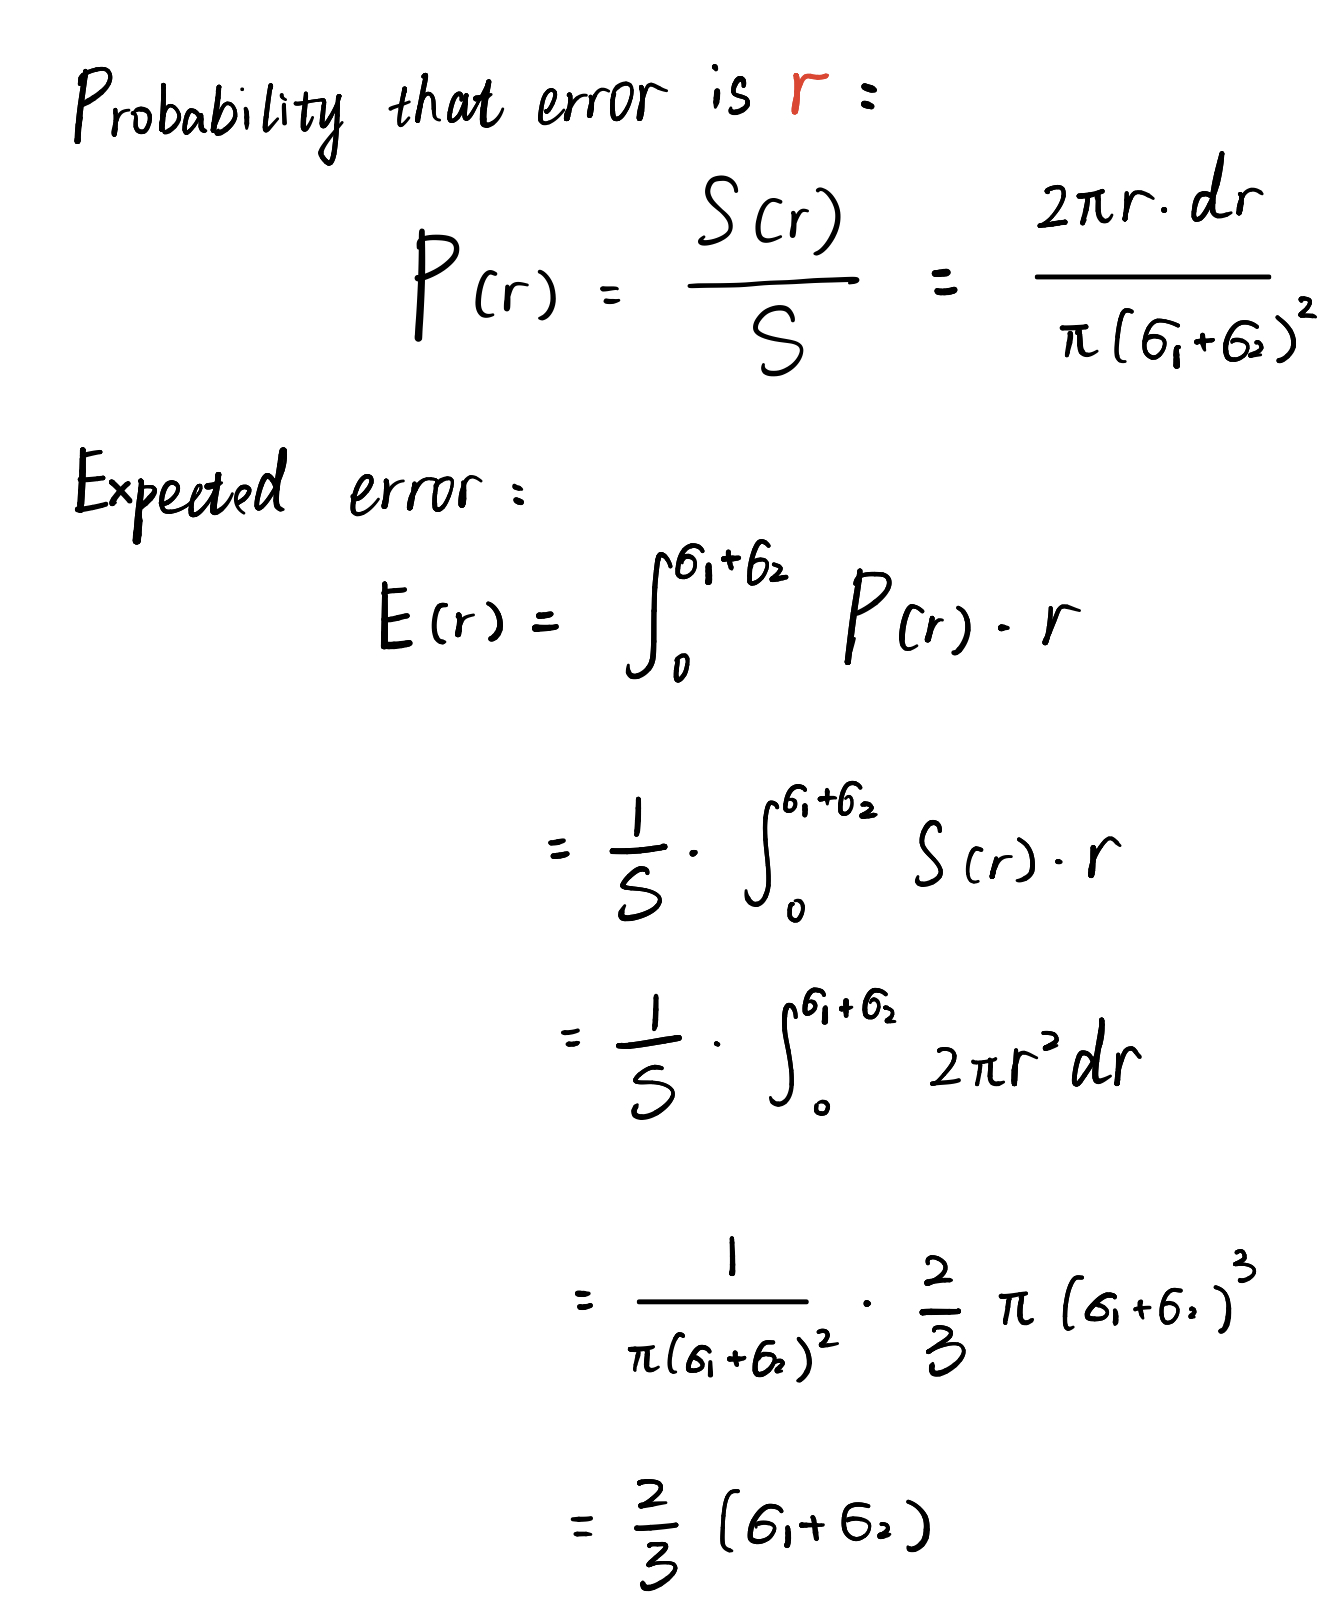
Since the mean error due to measurement accuracy is 0
The average error is: 2/3·(σ1 + σ2)
The maximum error is: (σ1 + σ2 + σ3)
I think it's more reliable to implemente PID control through orientation control. Before this lab, I tested the rotation of 90 degrees, 180 degrees and 360 degrees separately,
whose error is only about 5 degrees which is relatively reliable.
If the PID control is implemented via angular velocity, the car is more likely to cause data skew or errors due to the relatively longer time (~100ms) taken to obtain ToF readings during rotation.
In addition, since the position of the IMU sensor is not exactly at the rotation axis of the car, this also produces tiny and negligible errors.
It can be found from Single Point Measurement part that the raw data is more or less angularly offset relative to the Cartesian coordinate axis.
This is because the offset of its initial position when placing the car at sampling points, and the ToF sensor may not be perfectly facing forward.
Therefore, before merging the data, it is necessary to rotate the data at each sampling point to a certain extent, so that they are relatively aligned.